New Westminster's COVID-19 case count is down again, continuing a month of wildly swinging totals.
The city saw 33 new cases of coronavirus between Oct. 24 and 30, as per the latest data from the B.C. Centre for Disease Control. That's down 42% from last week, when New West recorded 57 new cases – which, in itself, was a dramatic upward swing from the previous week, when it saw 39. The week prior to that (Oct. 3 to 9), the local total had been 56.
New Westminster's test positivity rate remains at 4% for all public tests, the same as the previous two weeks, suggesting that the change in totals is reflective of differences in the number of people getting tested.
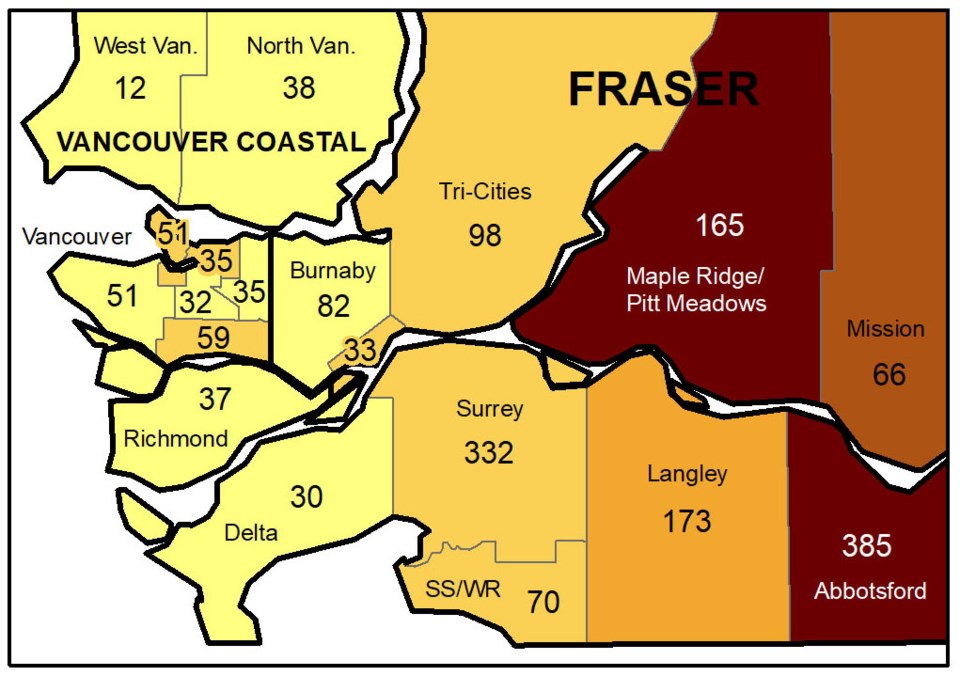
This week's case numbers put New Westminster's case count on a relatively even footing with neighbouring Richmond (at 37) and Delta (at 30), but both those municipalities have larger populations than New Westminster.
New Westminster's daily case rate for the week of Oct. 26 to Nov. 1 stood at 6 per 100,000, down from 9 per 100,000 last week.
Daily case rates have dropped below 5 per 100,000 for a number of Lower Mainland municipalities, including Richmond, Delta, Burnaby, North Vancouver, West Vancouver and parts of Vancouver.
New Westminster is sitting in the 5-to-10 range with Surrey, South Surrey/White Rock, parts of Vancouver and the Tri-Cities.
The Lower Mainland municipalities currently faring the worst, with more than 20 cases per 100,000, are Maple Ridge/Pitt Meadows and Abbotsford.
Follow Julie MacLellan on Twitter @juliemaclellan.
Email Julie, [email protected].


