Thirty-three students in New Westminster schools had COVID-19 and three case “clusters” occurred in local schools in the first nine weeks of 2021.
Those numbers are among newly released data from Fraser Health.
The data, which was previously unavailable to the public, was posted on Fraser Health’s website this week following a now highly publicized leak of B.C. Centre for Disease Control data.
The data looks at COVID-19 cases in the region’s kindergarten-to-Grade 12 schools, with a focus on clusters and transmission, between Jan. 1 and March 7.
It examined all schools where more than one COVID-19 case was reported within a 14-day period to determine whether the virus was transmitted in school and to pinpoint where clusters and outbreaks had occurred. (A “cluster” refers to a case in which at least one in-school transmission occurred within a 14-day period; an outbreak involves evidence of ongoing transmission in multiple areas of a school.)
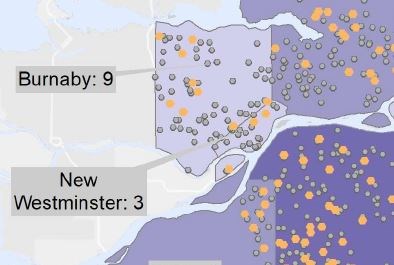
In New Westminster, there were 33 cases identified in students (including all public and independent schools), with three clusters. The schools are not specifically named, but a map included in the report (see image at top) pinpoints the locations of the clusters, which correspond to the locations of Richard McBride Elementary School, Glenbrook Middle School and Queensborough Middle School.
The report reveals that, in total, 2,049 COVID-19 cases occurred across all school districts in the Fraser Health region, which covers the territory from Burnaby to the Fraser-Cascade district (Hope and surrounding area). Of those, the report finds that 267 cases, or 13%, were “likely or possibly” acquired from school, with another 333 suspect cases where officials have been unable to rule out in-school transmission.
In total, there were 115 confirmed clusters involving 347 cases in 96 schools, with the size of clusters varying from two to 11 cases in public schools. Most clusters, according to the report, were limited to two cases.
(It also identifies one outbreak in one school, involving 54 cases. The school is not named, but it was not in New Westminster.)
HOW DOES THIS COMPARE TO WHAT WE ALREADY KNEW?
Since the onset of the pandemic, the Record has been tracking exposure notifications in New Westminster schools – the only measure of COVID-19 cases in the K-12 system that has been made public.
Exposure notifications are routinely mailed to school communities listing dates when a person with COVID-19 was present in a school during their potentially infectious period. The notification information provides dates of exposure, but it is never specified how many cases may be involved in one particular exposure notification, and it’s not known whether those cases involved students or staff, or both.
The dates of those exposures are also regularly posted on the Fraser Health school exposures website but removed after the 14-day infectious period has passed. The school exposures site has never referred to any of the New Westminster cases as “clusters”; they have all been listed simply as “exposures.”
The New Westminster school district also provides monthly roundups of notification letters sent to the community, which are publicly available in the agenda packages for its meetings from Feb. 9, March 9 and April 13.
From the Record’s compilation, there were 27 exposure notifications in New Westminster public schools and one in an independent school covering the dates involved in the study (Jan. 1 to March 7, 2021).
How many of those notifications involved staff and how many involved students is not known.
It is clear, however, that at least some of those exposure notifications involved more than one case – since the number of student cases revealed in the report (33) exceeds the number of notifications sent out in the same time period. (In other instances, exposure notifications may not have been sent if cases weren't identified until after the 14-day infectious period had elapsed.)
New Westminster school district superintendent Karim Hachlaf, in a report to the school board’s operations committee May 11, acknowledged that exposure notifications can be anxiety-provoking but stressed the notifications do not mean there has been in-school transmission of the virus.
“It was a proactive measure to inform the community, but it didn’t mean direct transmission in schools,” he said.
HOW DO NUMBERS COMPARE TO COMMUNITY CASE COUNTS?
Since the beginning of the pandemic, public health messaging has been consistent: Schools are a reflection of what’s happening in the communities around them.
The Fraser Health report provides a page with graphs showing the weekly incidence rate in communities and in the student population of each school district (see image carousel above).
Hachlaf pointed out New Westminster’s incidence rate is among the lowest in the health region – behind only the Mission and Fraser-Cascade school districts.
The 33 student cases in New Westminster compare to 656 community cases in the same time period.
“We are a reflection of the community. That said, we’re not a direct reflection, because school transmission is significantly lower than the community exposures,” Hachlaf said.
He said that, when cases spike in communities, those numbers tend to be reflected in schools.
For New Westminster, the data backs up that reality – with the chart provided in the Fraser Health report showing a similar trend line (see image above) between school and community numbers as the weeks have passed.
The Record also did a graphing exercise plotting the number of exposure notifications in schools between Jan. 1 and May 1, and community case counts in the same time period.
Although the trend line of the two graphs diverged somewhat in the early part of the year, recent weeks have shown the school curve reflecting the same curve as case counts in the community – with rises and falls in school numbers tending to show up about one week behind the community numbers.
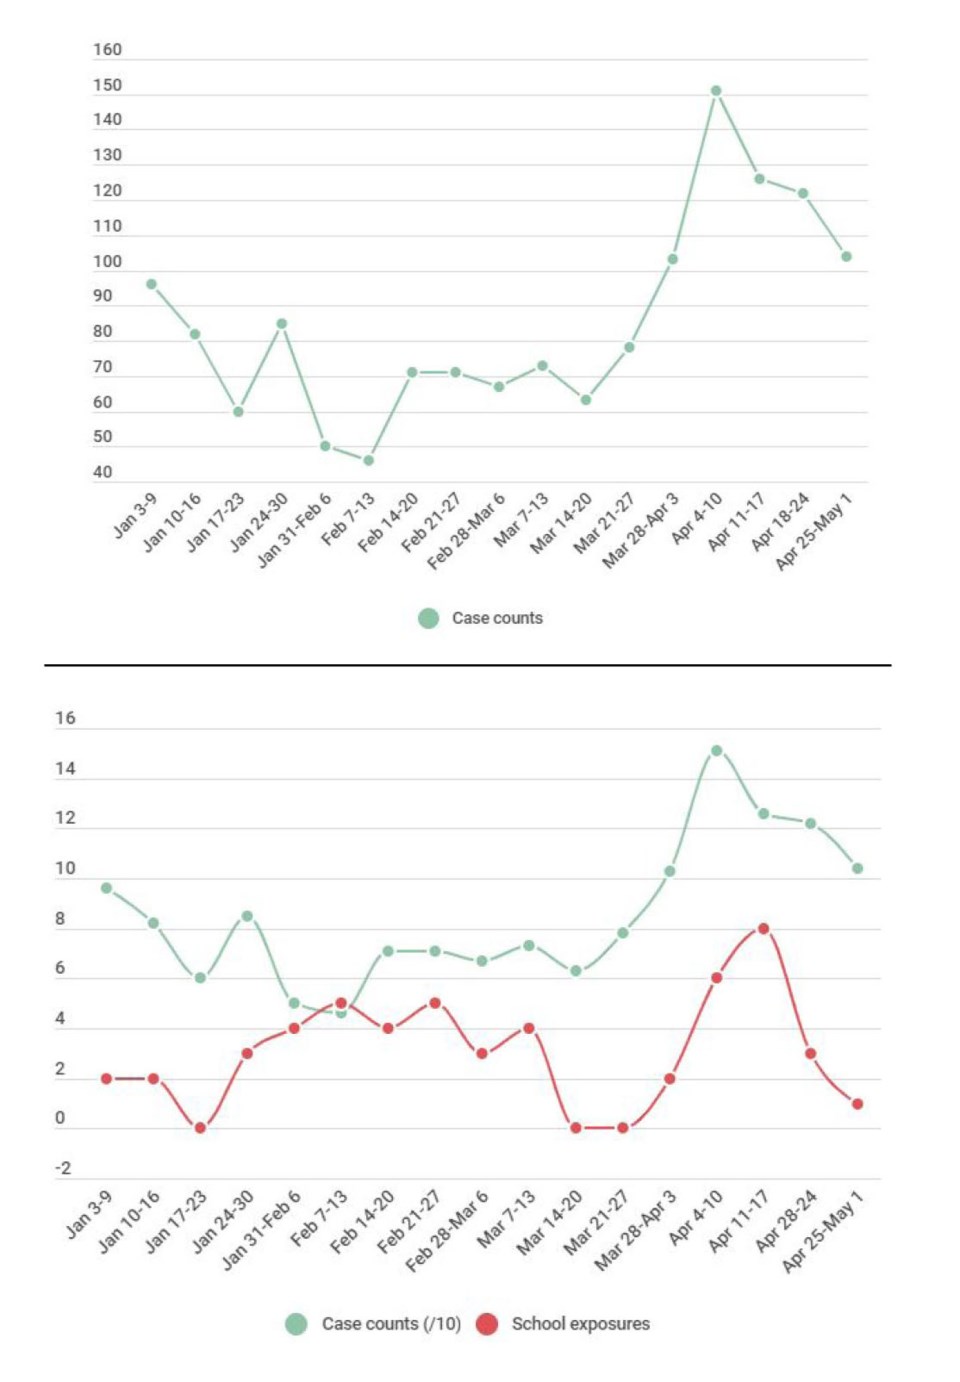 The top graph shows how COVID-19 case counts in New Westminster have trended in 2021. The bottom graph overlays that information (in one-tenth scale) on top of school exposure notification data to show the comparison of the two datasets. The school notifications curve has largely mimicked the community case count curve, particularly since March. By New Westminster Record (with data from Fraser Health/BCCDC)
WHO’S TRANSMITTING TO WHOM?
A key part of the newly released Fraser Health report centres on the direction of transmission – that is, who’s giving the virus to whom?
It finds that 72.8% of clusters started after the virus was brought into schools by students.
“This was expected, as students proportionately make up the majority of the school population,” the report says.
In New Westminster, the report breaks down the source of the four cases acquired from clusters: two from student-to-student transmission, one from student to staff, and one from staff to student.
Whether any of those school cases had broader ripples in the community is not set out in detail.
The report does note that, of the 267 cases that were likely/possibly acquired from school, 88 of those led to further household or community transmission, “mostly within the household.”
But it does not break down the chains of further transmission, if any, for each individual school district or cluster.
IMPACT OF VARIANTS NOT YET KNOWN
The report tracks variant of concern cases that had appeared in schools as of March 7, identifying variants of concern in 8% of school cases.
However, the report points out that the study period reflects only the early stages of the variant introduction into B.C. communities and, as a consequence, their impact is “not fully assessed” in the study.
The three New Westminster clusters in the report did not involve variants of concern.
Now, Hachlaf noted, health officials presume that most COVID-19 cases do, in fact, involve variants of concern. He said Fraser Health will be tracking data beyond March 7 to see how the variants and immunization rates change the picture – data Hachlaf told the board he will share onwards at a future date.
EXPOSURE NOTIFICATIONS HAVE TRENDED UP
What we do know so far is that the number of exposure notifications in the New Westminster school district continued to rise steadily after the March 7 cut-off date in the recently released study.
Hachlaf noted the number of exposure notices sent out in the period from April 9 to May 6 increased over the previous month, with 17 general notifications compared to 10 the month before. The number of self-monitor notifications rose from 11 to 18, and self-isolation notices rose from 11 to 15.
“Overall, yes, we have increased, but certainly I’m still optimistic because if we look right now at the community transmission, we are seeing lower rates, a bit of bending the curve, which is fantastic,” he said. “I certainly hope those numbers are reflective as we finish off the school year.”
In total, the Record has tracked 27 notifications (24 in the public school district and three at independent/private schools) from March 8 to now.
Of those, four public schools – New Westminster Secondary School, Glenbrook Middle School, Richard McBride Elementary School and Lord Kelvin Elementary School – saw more than one case reported within a 14-day period. Whether any of those cases have been connected or will be reported as a “cluster” remains to be seen in future Fraser Health reporting.
Follow Julie MacLellan on Twitter @juliemaclellan.
Email Julie, [email protected].


