New Westminster's COVID-19 case count has taken a turn for the worse.
The city saw 38 new COVID-19 cases between Nov. 28 and Dec. 4, as reported by the B.C. Centre for Disease Control. The new count is a sharp rise – just shy of an 81% increase – from the 21 cases recorded the week before. The new total brings an abrupt end to a month-long downward trend.
The city's daily case rate stands at 8 per 100,000, up significantly from 3 per 100K last week.
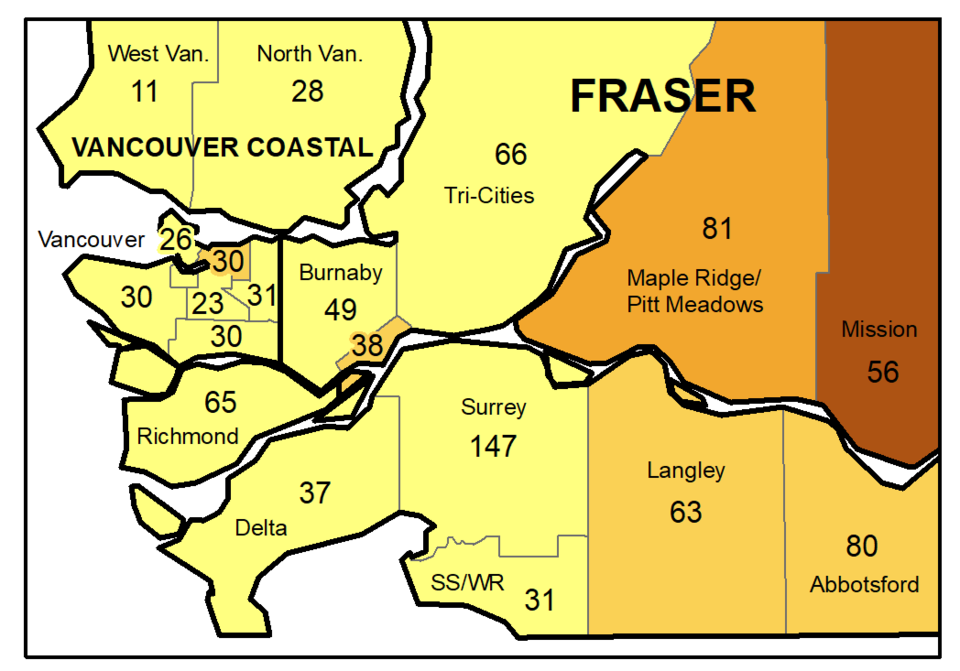
The spike in cases appears to be isolated to New Westminster, rather than reflecting a regionwide trend. The latest BCCDC map shows New Westminster in the 5-to-10 cases per 100K category. Meanwhile, the majority of other Lower Mainland municipalities (Burnaby, Tri-Cities, Richmond, Delta, Surrey, South Surrey/White Rock, West Vancouver, North Vancouver and most of Vancouver) are in the 1-to-5 case range.
In raw numbers, New Westminster's case count is similar to Burnaby's, at 49, though the neighbouring city is three times the size.
Elsewhere in the Lower Mainland, Langley and the east side of Vancouver remain at 5 to 10 cases per 100K, like New Westminster. Maple Ridge/Pitt Meadows and Abbotsford are at 10 to 15 cases per 100K, while Mission shows a case rate of 15 to 20 per 100K.
New Westminster's test positivity rate has also spiked. Test positivity (for all public tests) between Nov. 30 and Dec. 6 stood at 5%, up from 2% the week before.
Follow Julie MacLellan on Twitter @juliemaclellan.
Email Julie, [email protected].


