More than 300,000 COVID-19 cases have been reported in B.C. since the beginning of the pandemic – and more than 5,500 of those were in New Westminster.
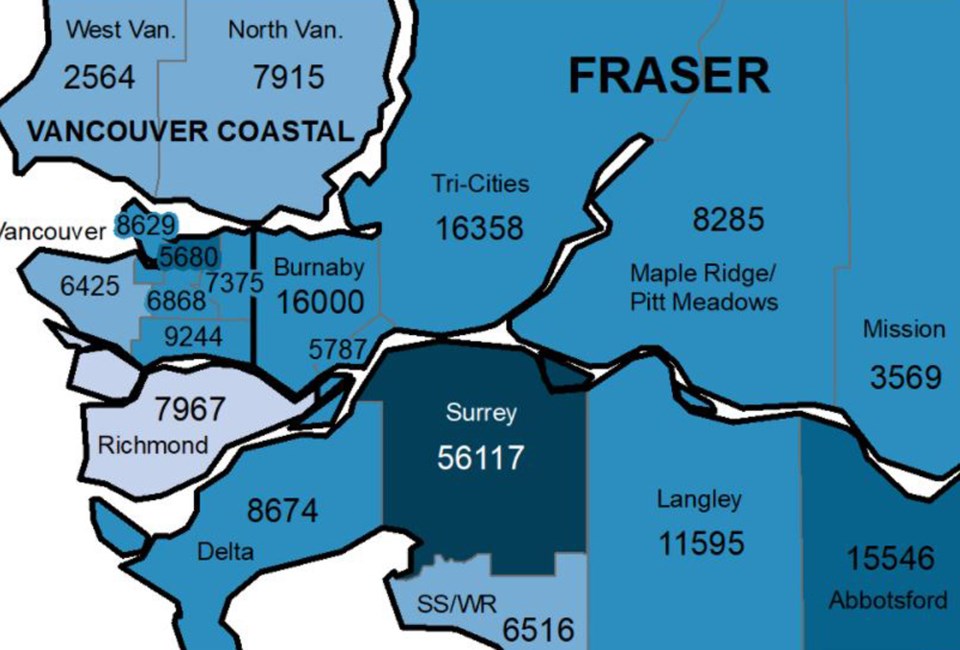
The latest data from the B.C. Centre for Disease Control, as of the end of February 2022, shows a total of 5,787 cases in New Westminster since the beginning of the pandemic.
On a per capita basis, that translates into a rate of 6,000 to 8,000 per 100,000 residents. That's on par with much of Metro Vancouver, including Burnaby, the Tri-Cities, Delta, Langley, Maple Ridge-Pitt Meadows and parts of Vancouver.
Some municipalities – including parts of Vancouver, North Vancouver, West Vancouver and South Surrey/White Rock – have had fewer cases per capita, with a rate of 4,000 to 6,000 per 100K. Richmond shows the fewest cases per capita, with 2,000 to 4,000 per 100,000.
On the flip side, Surrey has fared the worst amongst Metro Vancouver municipalities, with a per-capita rate of greater than 10,000 per 100K.
As of March 29, the B.C. Ministry of Health reported 355,935 COVID-19 cases since the start of the pandemic. Those numbers, however, do not reflect all the COVID cases in the province, since testing has been severely restricted since the Omicron surge reached its height in January.
Follow Julie MacLellan on Twitter @juliemaclellan.
Email Julie, [email protected].